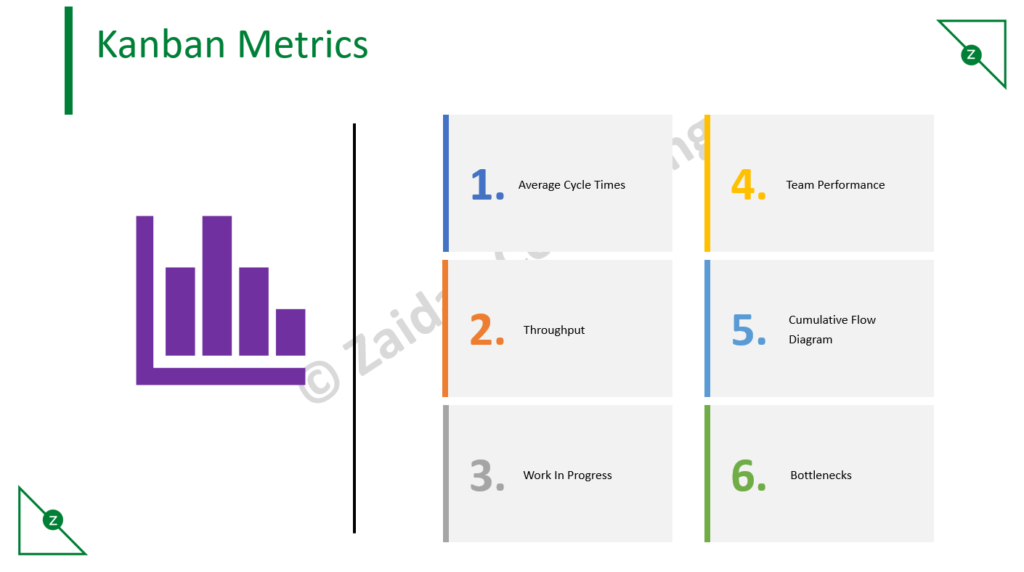
Kanban Metrics: How do you measure your deliverable efficiency in Kanban? How do you know how much efficient is your Kanban? Here are some metrics
Video: Kanban Metrics
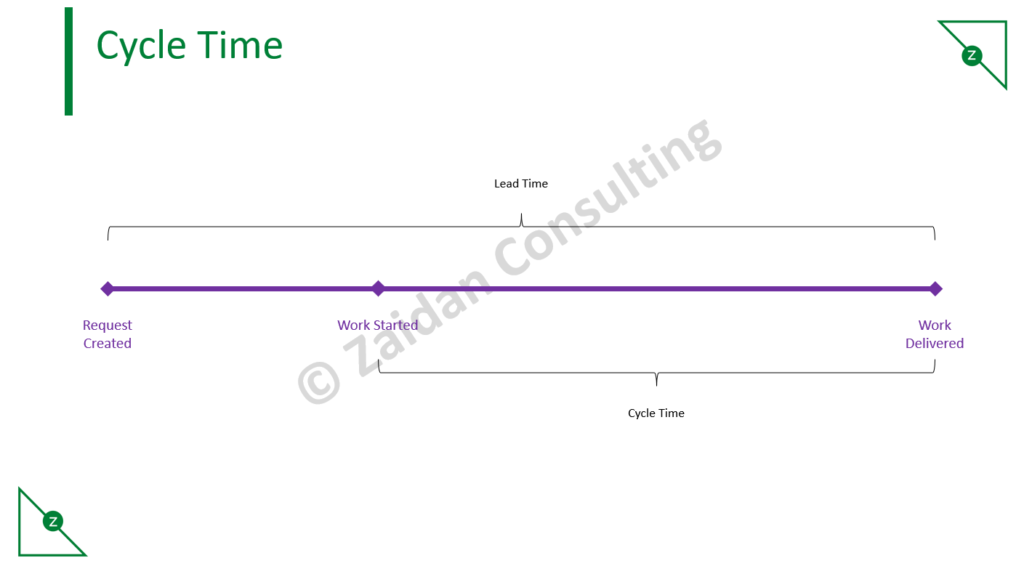
Cycle Time
Cycle Time is the metric that directly measures how long it takes your team to deliver a task. Low cycle times mean your team is working efficiently, high cycle times indicate that something is stalling your process. Keeping your cycle times down keeps your lead times down, and leads to high customer satisfaction.
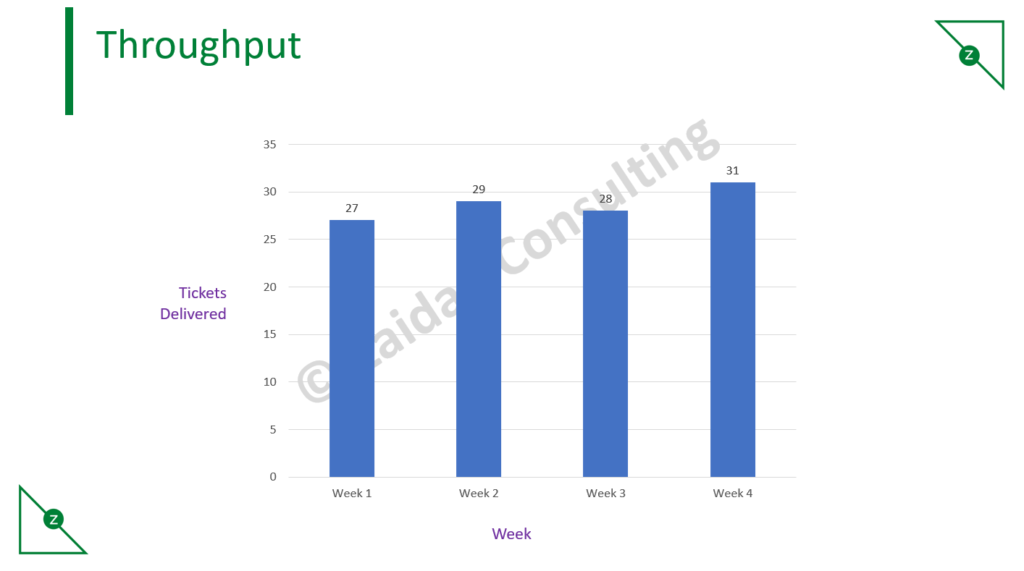
Throughput
Whereas cycle time measures how long it takes an individual task to go through your process, the throughput metric in Kanban measures the total amount of work delivered in a certain time period. Throughput only measures completed work items – nothing that is still in progress gets counted.
WIP Limit
A key component of the Kanban Method is limiting Work In Progress (WIP) to improve your team’s efficiency. Think about it – do you get work faster when you split your attention between many tasks, or when you choose one to focus on?
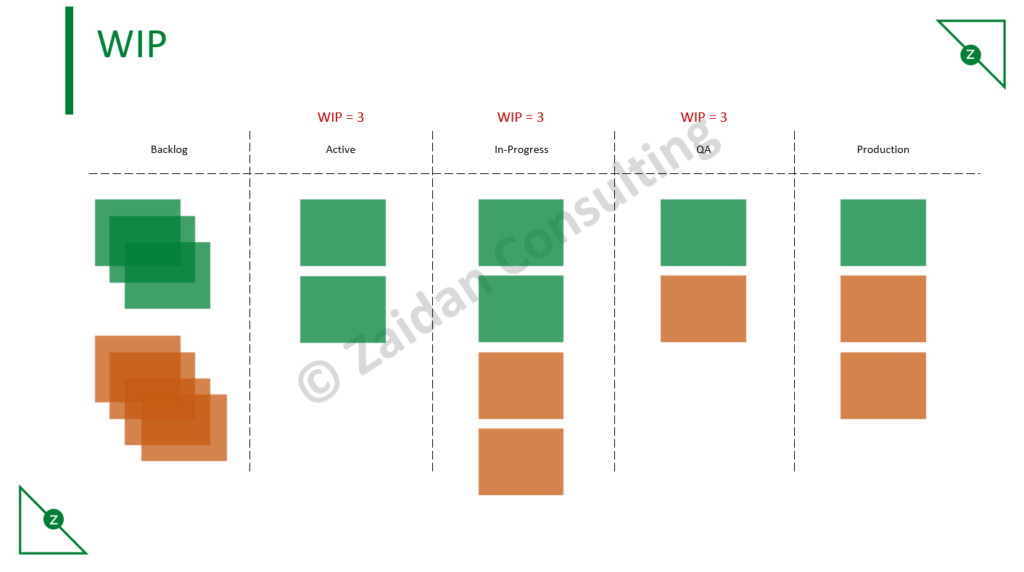
The optimum WIP limit for your team will depend on several factors such as the size of your team, however a good place to start is setting the limit at around the number of people in your team – this way, everyone can focus on one task at a time
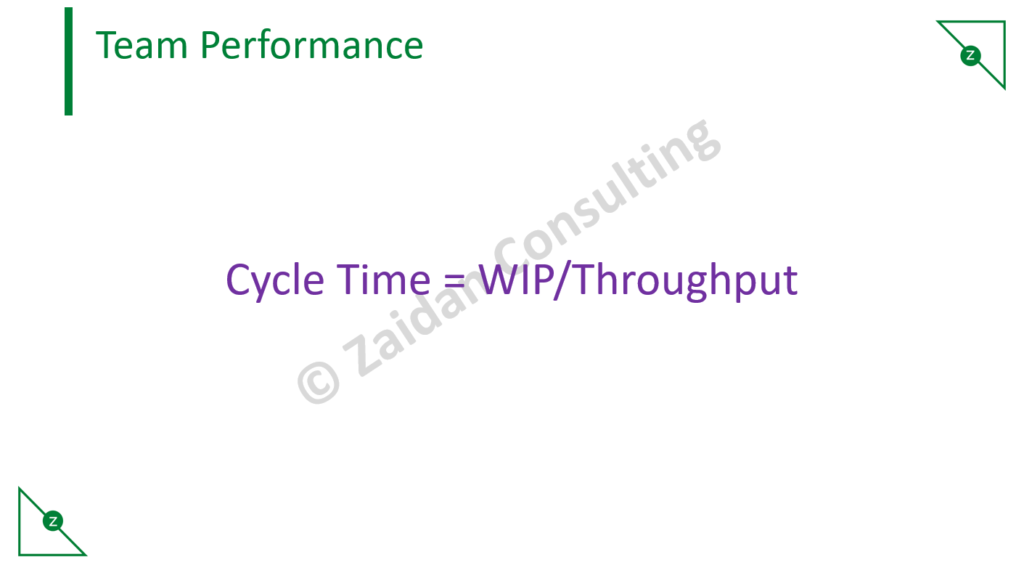
Team Performance
Little’s Law shows the relationship between the three basic flow metrics, and that changing one will have an effect on the other two. For example, for a reduction in cycle time, WIP must decrease.
Short cycle times and high levels of throughput are signs of good team performance, but another thing to look out for is consistency. From the cycle time histogram and throughput histogram, you can not only see the average value of your Kanban metrics but also how this data is distributed over a period of time. When your values are spread over a smaller range, your future predictions are naturally more accurate.
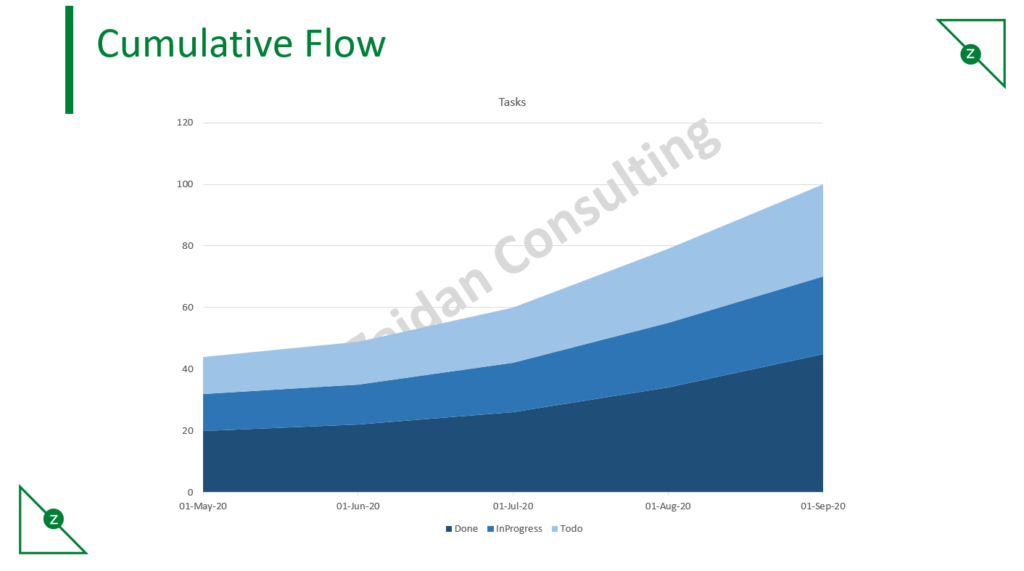
Cumulative Flow Diagram
The cumulative flow diagram shows the distribution of tasks in each of the process states, accumulating over time. Each colored band indicates how many tasks are present in each stage of the process at a given time. Approximate average cycle time can be calculated straight from the diagram, but the real benefit of the CFD is how quickly you can get a visual assessment of the stability of your process.
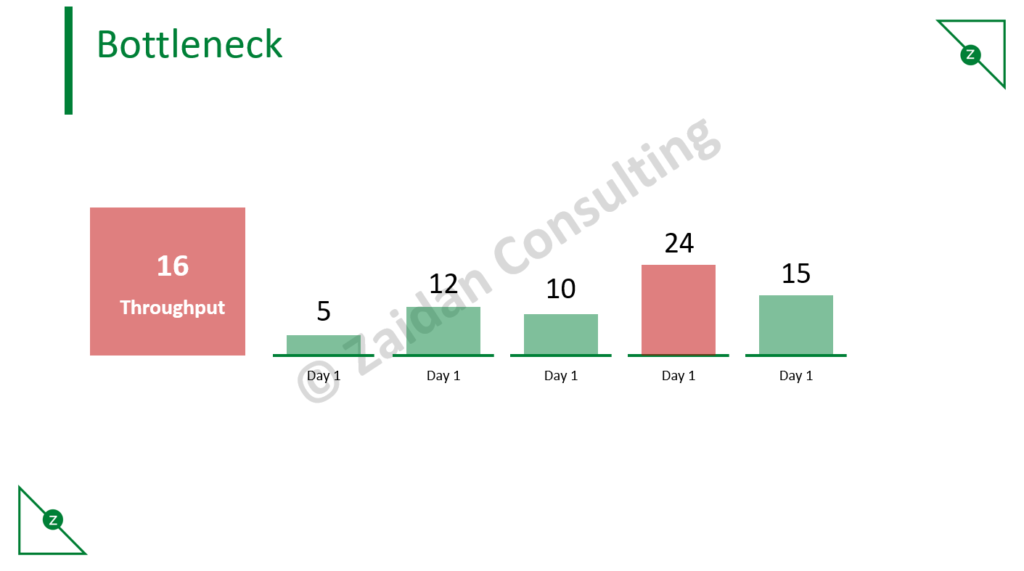
Bottleneck
The biggest red flag that your performance is about to suffer is the bottleneck – increasing work that is not being completed. The bottleneck signals that your team does not have the resource capacity to handle the amount of work assigned to them in a timely manner.
Our PMI® PMP®-Prep Course
If interested in this course, click here
- Case study based training
- LIVE instruction 36 Hours
- Post course guidance
- Exercise per topic
- 4 Mock exams for practice
- WhatsApp group support
Our PMI® ACP®-Prep Course
If interested in this course, click here
- WhatsApp group support
- 4 Mock exams for practice
- Exercise per topic
- LIVE instruction 20 Hours
- Post course guidance
- Case study based training

JD (Coach/Instructor/Writer)
JD (a.k.a Janakiram) is a Project Management Coach, Trainer Author and Practitioner @Zaidan Consulting. He comes with around 17+ Years of experience primarily from the Software Industry. He is certified on PMI® PMP®, ACP®, Scrum Alliance CSM and Microsoft Certified Solution Developer on C#.NET. He has also authored the book “Practical Agile for Beginners”

About Zaidan Consulting
Zaidan Consulting are specialists in Project and Program Management space. Our training offerings include:
- Project Management Training
- Agile Training
- PMI®-ACP® Prep Training
- PMI®-PMP® Prep Training
- PMI®-CAPM® Prep Training
- ScrumStudy™ Authorized Training Partner (A.T.P)
Or you can contact us @+(91) 7672011471
Or Email us: contact@zaidanconsulting.com